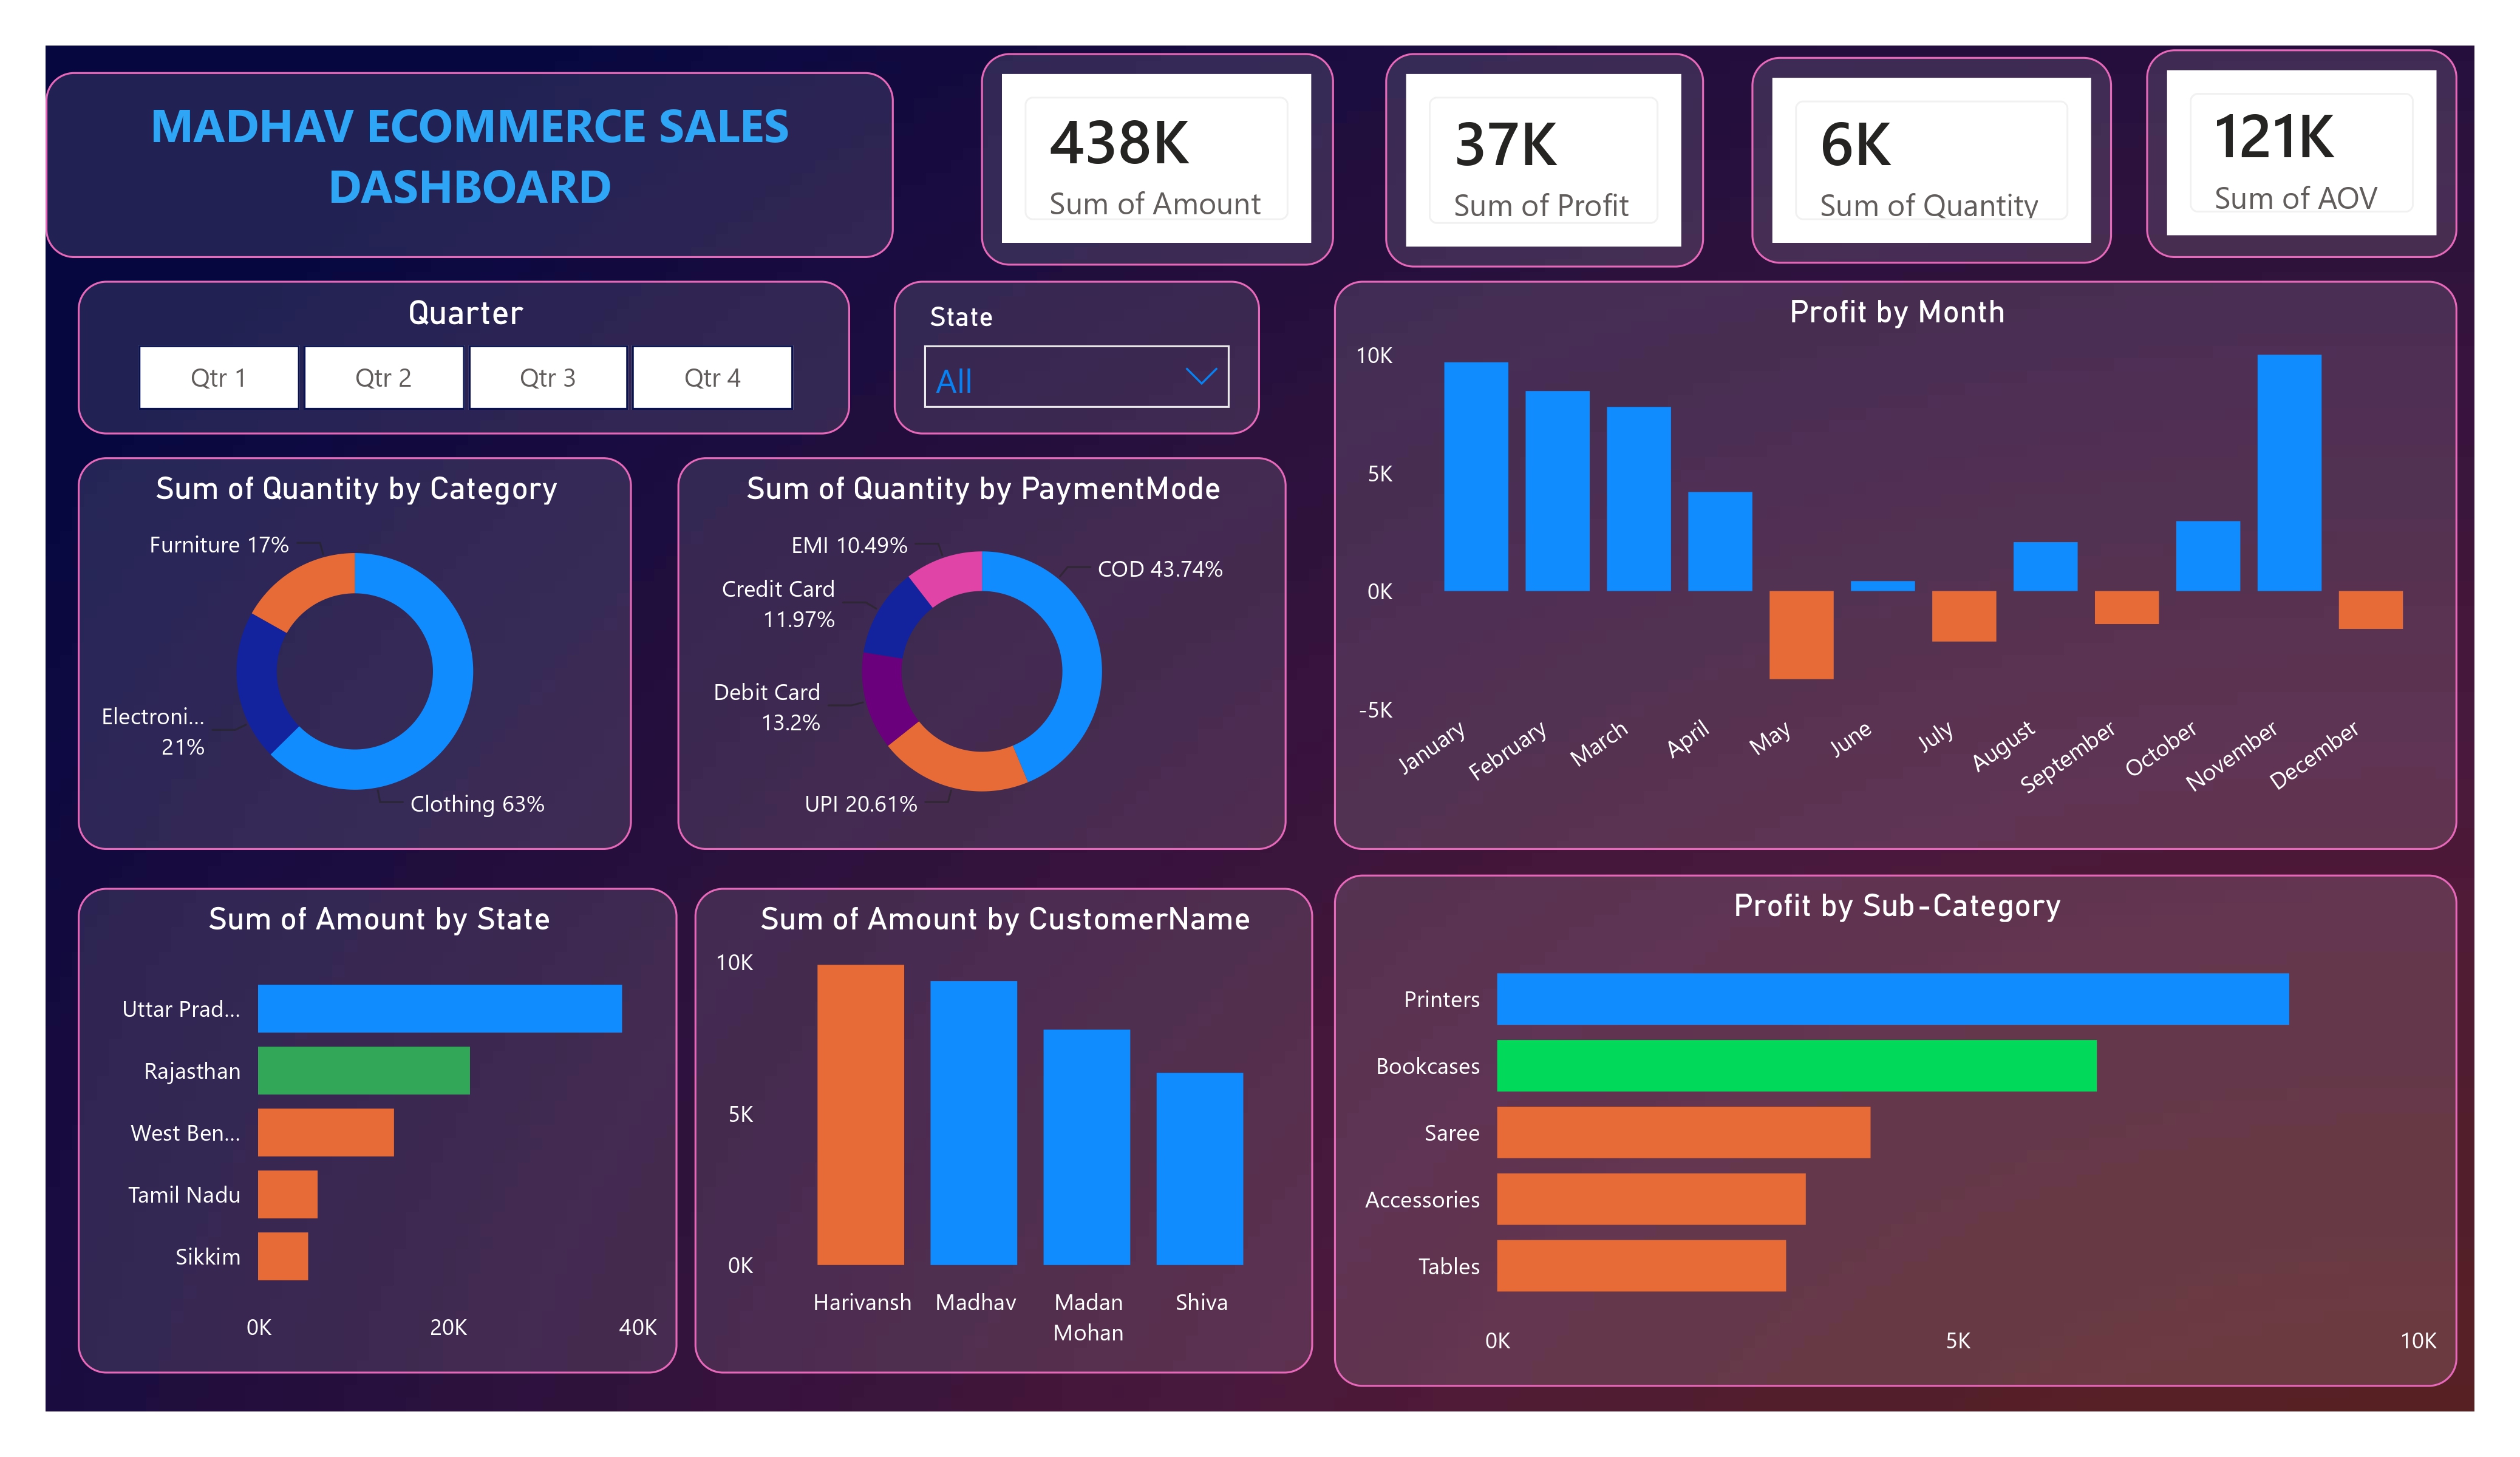
Project Overview
This Business Intelligence project transforms raw sales data into meaningful dashboards using Power BI. It enables stakeholders to monitor KPIs, identify trends, compare regional performance, and make data-driven business decisions.
Dashboard Highlights
Tool
Microsoft Power BI
Microsoft Power BI
Dataset
Retail Sales Data
Retail Sales Data
Domain
Business Analytics
Business Analytics
Type
Interactive Dashboard
Interactive Dashboard
Technologies Used
Dashboard Features
- Interactive KPI Cards
- Sales & Profit Analysis
- Region-wise Performance
- Monthly Trend Analysis
- Customer Segmentation
- Dynamic Filters & Slicers
Business Insights
- Top performing regions
- Best-selling product categories
- Revenue and profit trends
- Customer purchasing patterns
- Actionable insights for business growth
Dashboard Preview