Project Overview
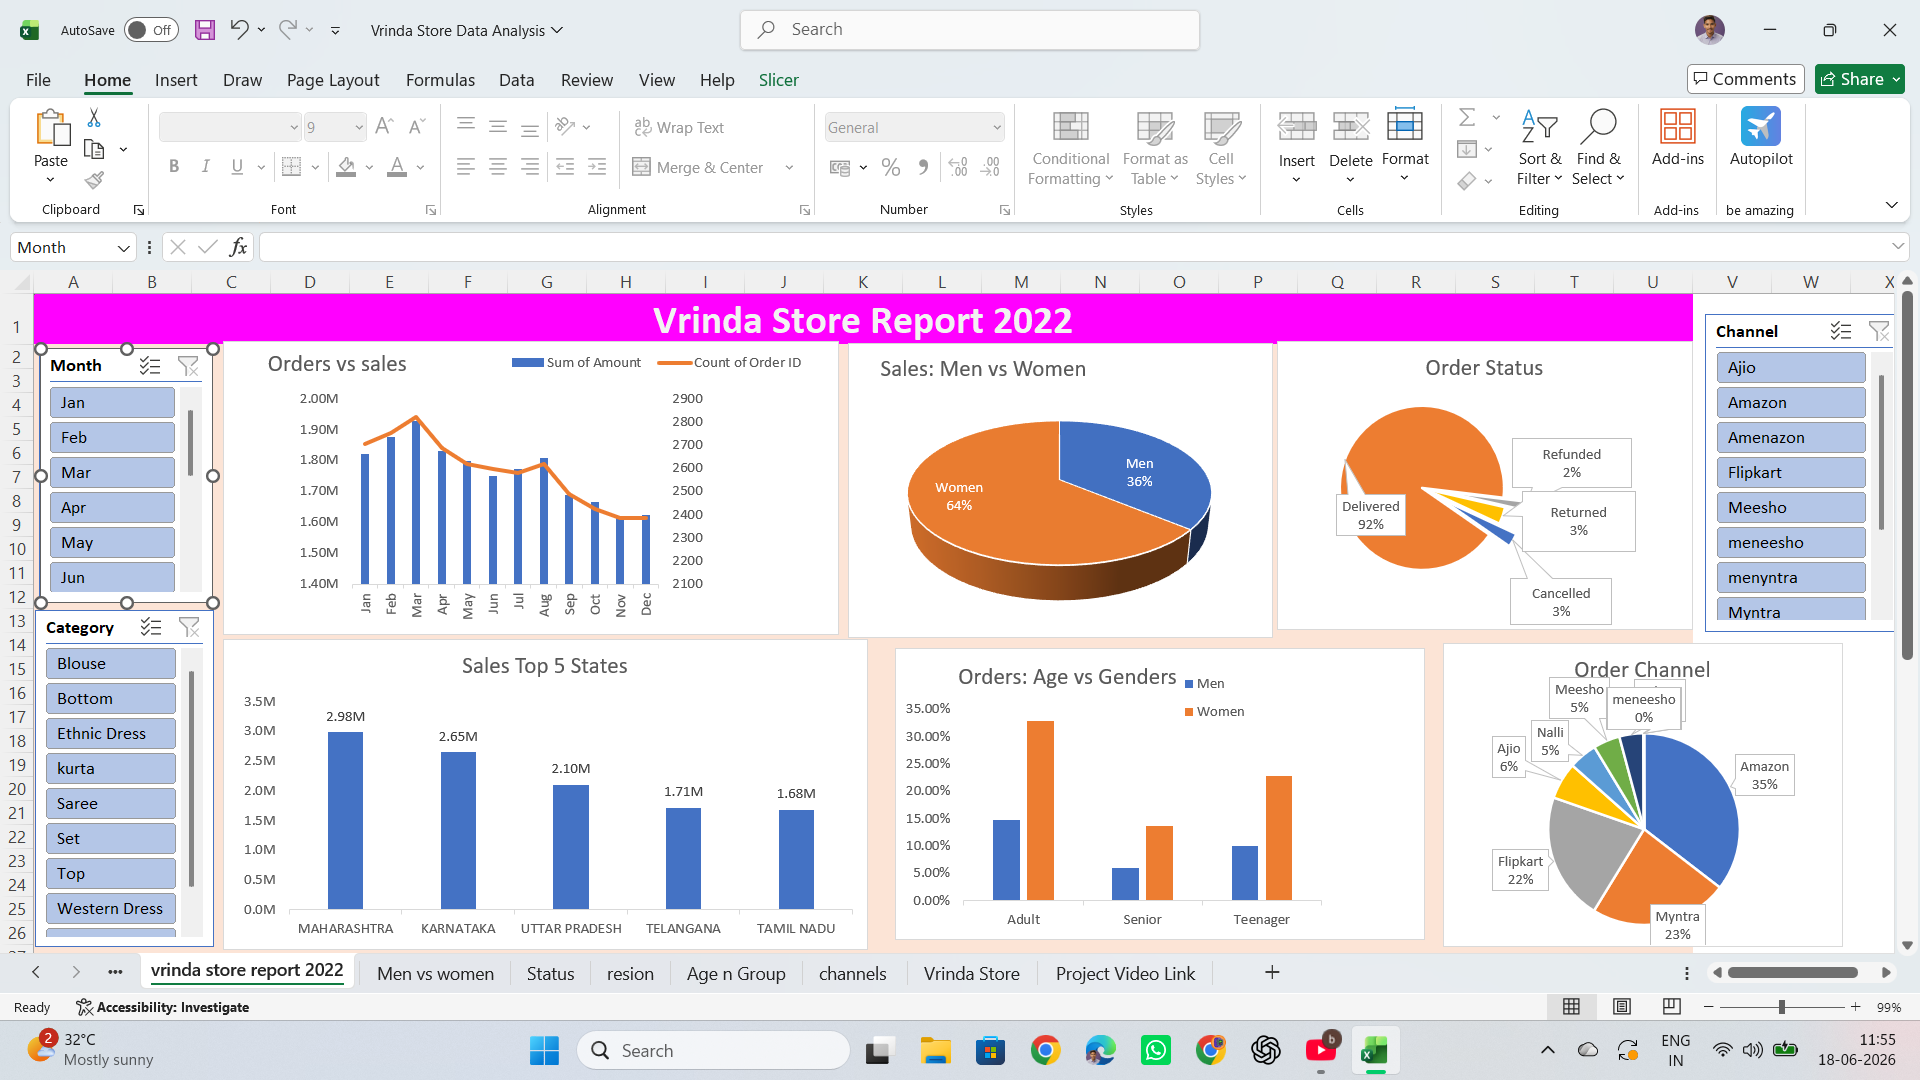
This project analyzes retail store sales data using Microsoft Excel. The dashboard provides a complete overview of sales performance, customer behavior, order status, state-wise performance, and sales channels, helping businesses make data-driven decisions.
Project Features
📊 Interactive Dashboard
📈 Pivot Charts & KPIs
🎛️ Slicers & Filters
📋 Business Insights
Dashboard Includes
- Monthly Orders vs Sales Analysis
- Sales by Gender
- Order Status Distribution
- Top 5 Performing States
- Age Group Analysis
- Sales by Order Channel
Tools & Skills Used
Microsoft Excel Pivot Table Pivot Chart Slicers Conditional Formatting Data Cleaning Dashboard Design Business AnalyticsKey Business Insights
- Identified top-performing states and sales channels.
- Compared monthly sales trends and order volume.
- Analyzed customer demographics based on age and gender.
- Tracked order delivery, returns, cancellations, and refunds.
- Provided KPI-based insights for business decision making.
Future Improvements
This dashboard can be extended by integrating Power BI, SQL, Python automation, forecasting models, and real-time business reporting.